Rural Deaf Experiences: Employment and Educational Attainment Data
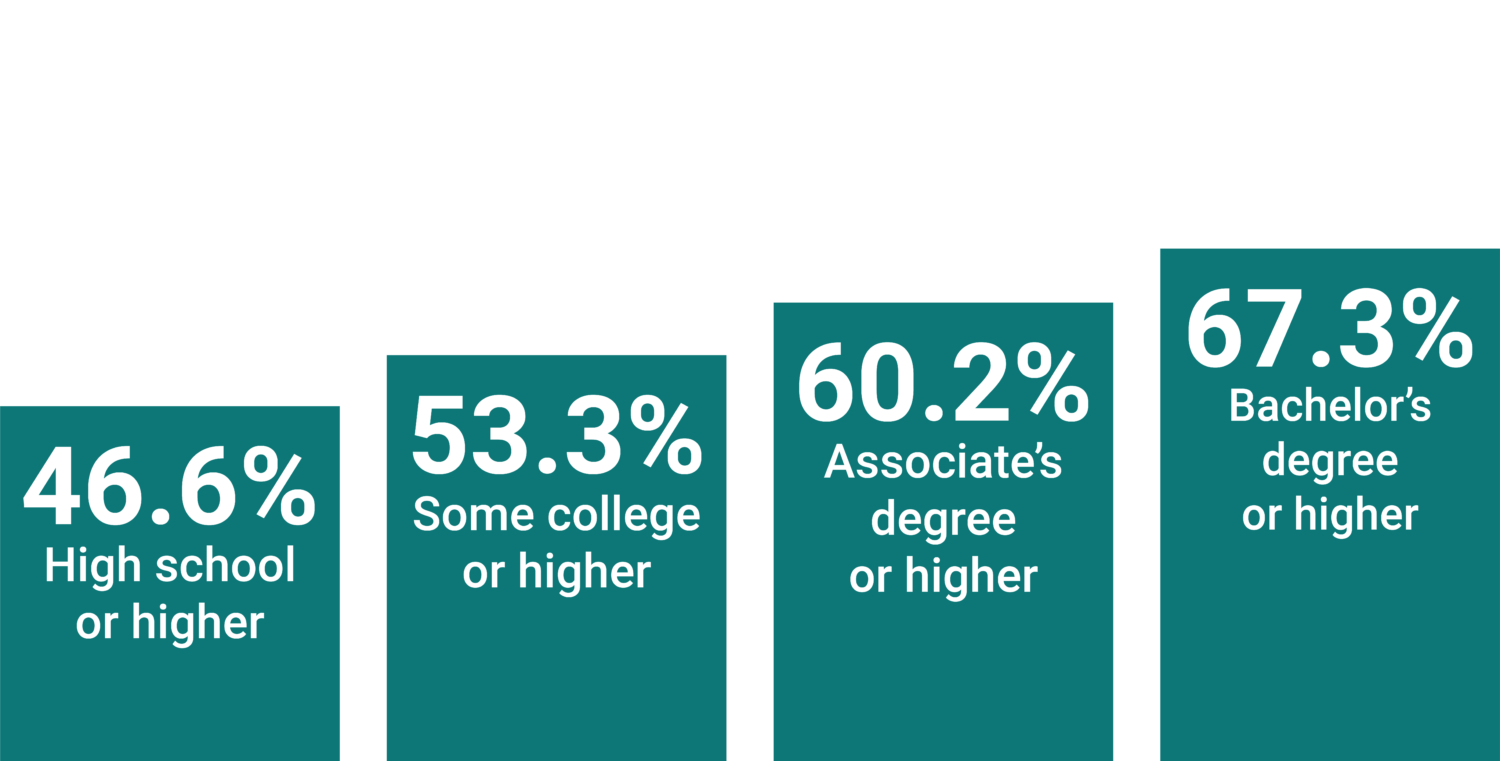
Our data indicate that employment and educational attainment differences persist between hearing and deaf people (Bloom et al., 2024). These differences are more significant in rural areas. Rural deaf people may experience unique and additional challenges, such as a lack of resources and tailored support services. For example, deaf people in rural areas are nearly twice as likely as hearing people to lack internet access (13.8% vs. 7.6%). These statistics indicate the importance of addressing challenges to higher education for deaf people in rural areas, as education plays a crucial role in improving employment outcomes.
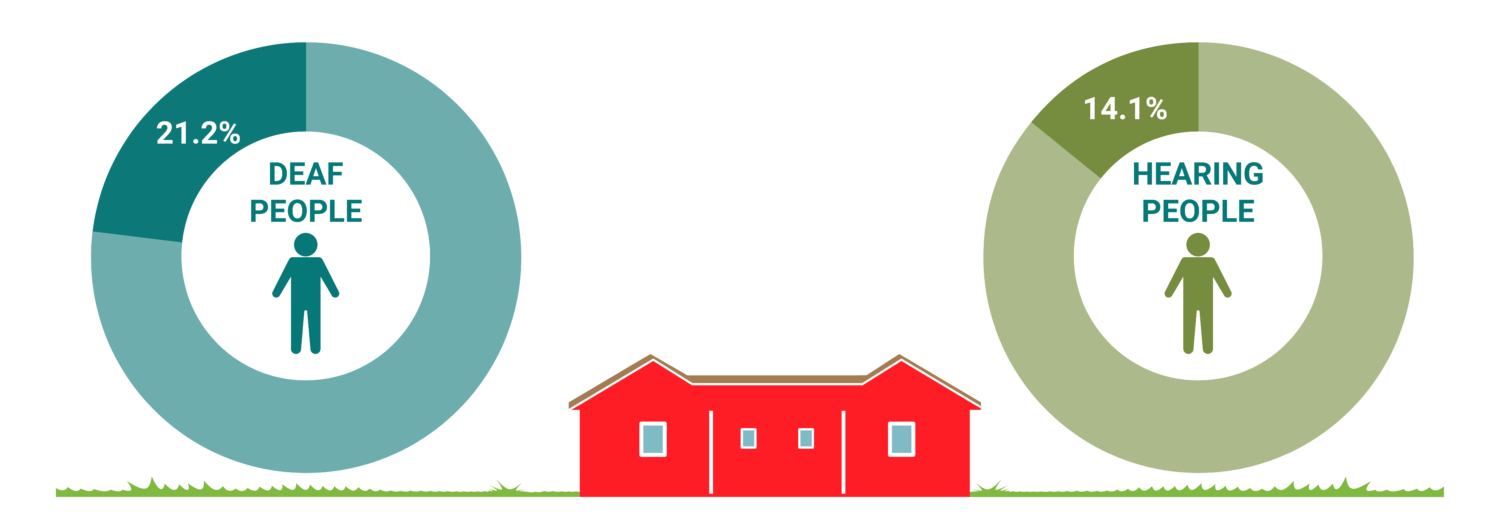
Nearly a quarter of deaf adults live in rural areas, a significantly higher rate than hearing people.
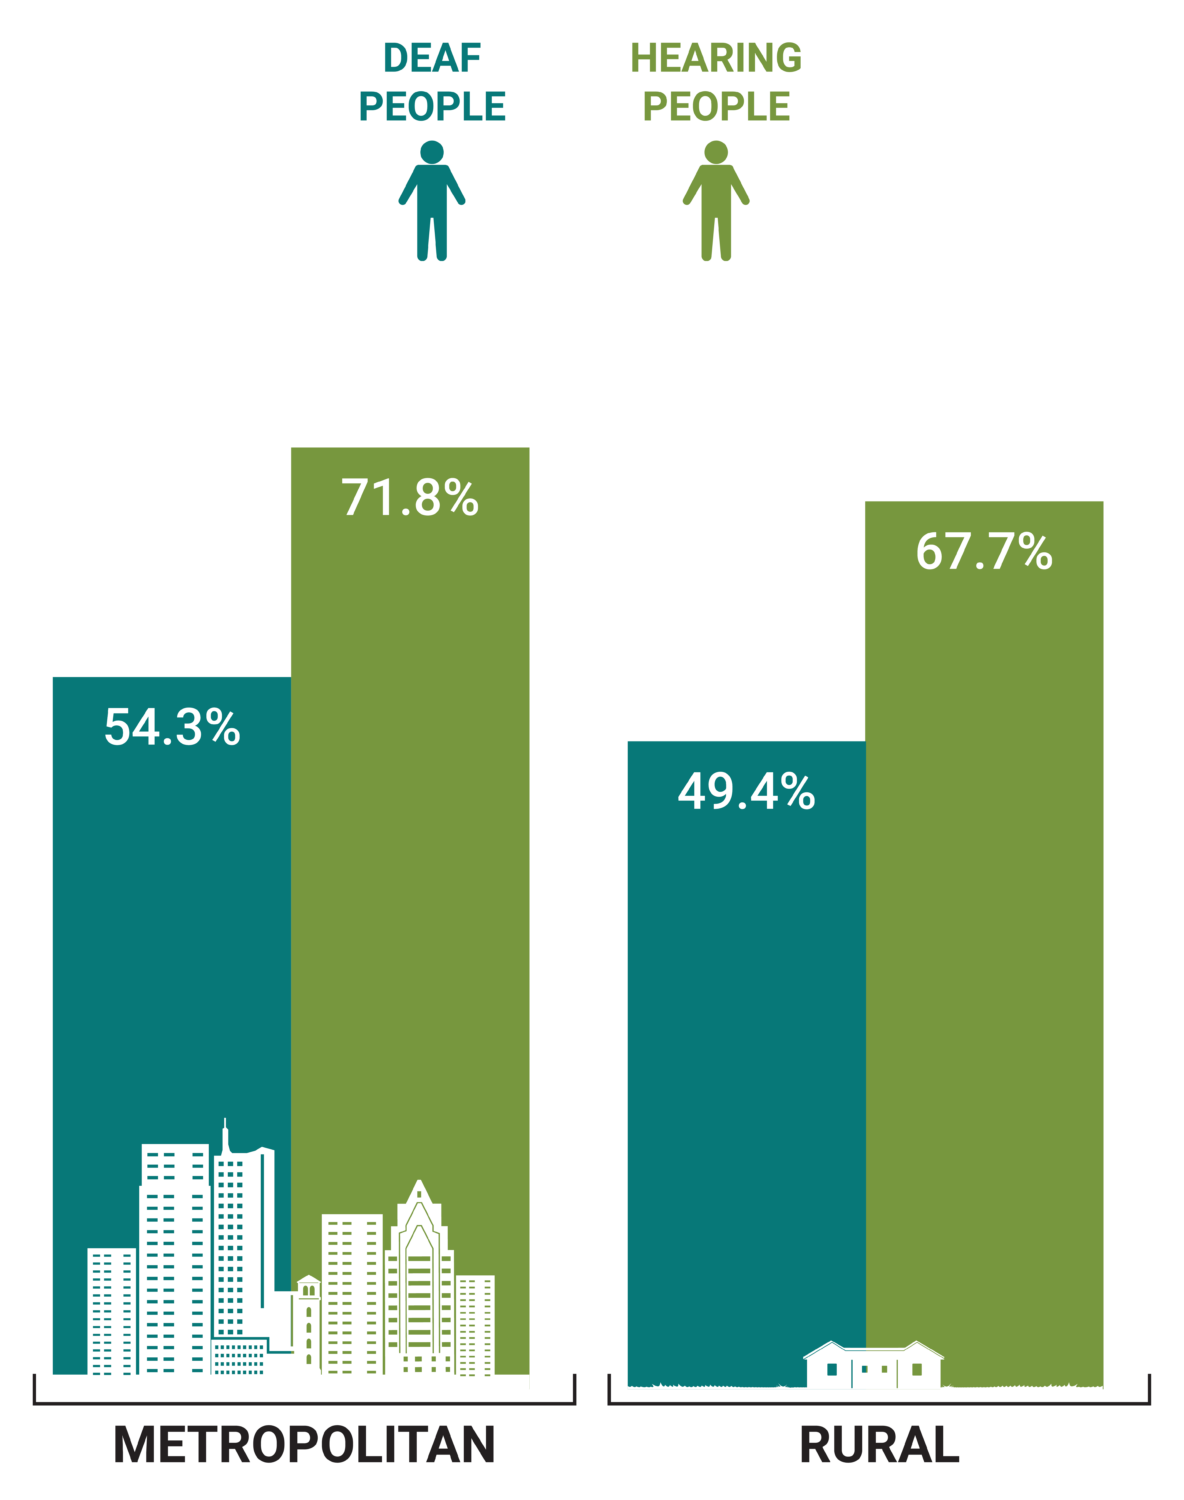
Employment by Area
Rural deaf people have lower employment rates than metropolitan deaf people and hearing people in both areas.
Employment by Group
Nearly a quarter of deaf adults live in rural areas, a significantly higher rate than hearing people.
For more detailed information, see Tables 1-3 below.
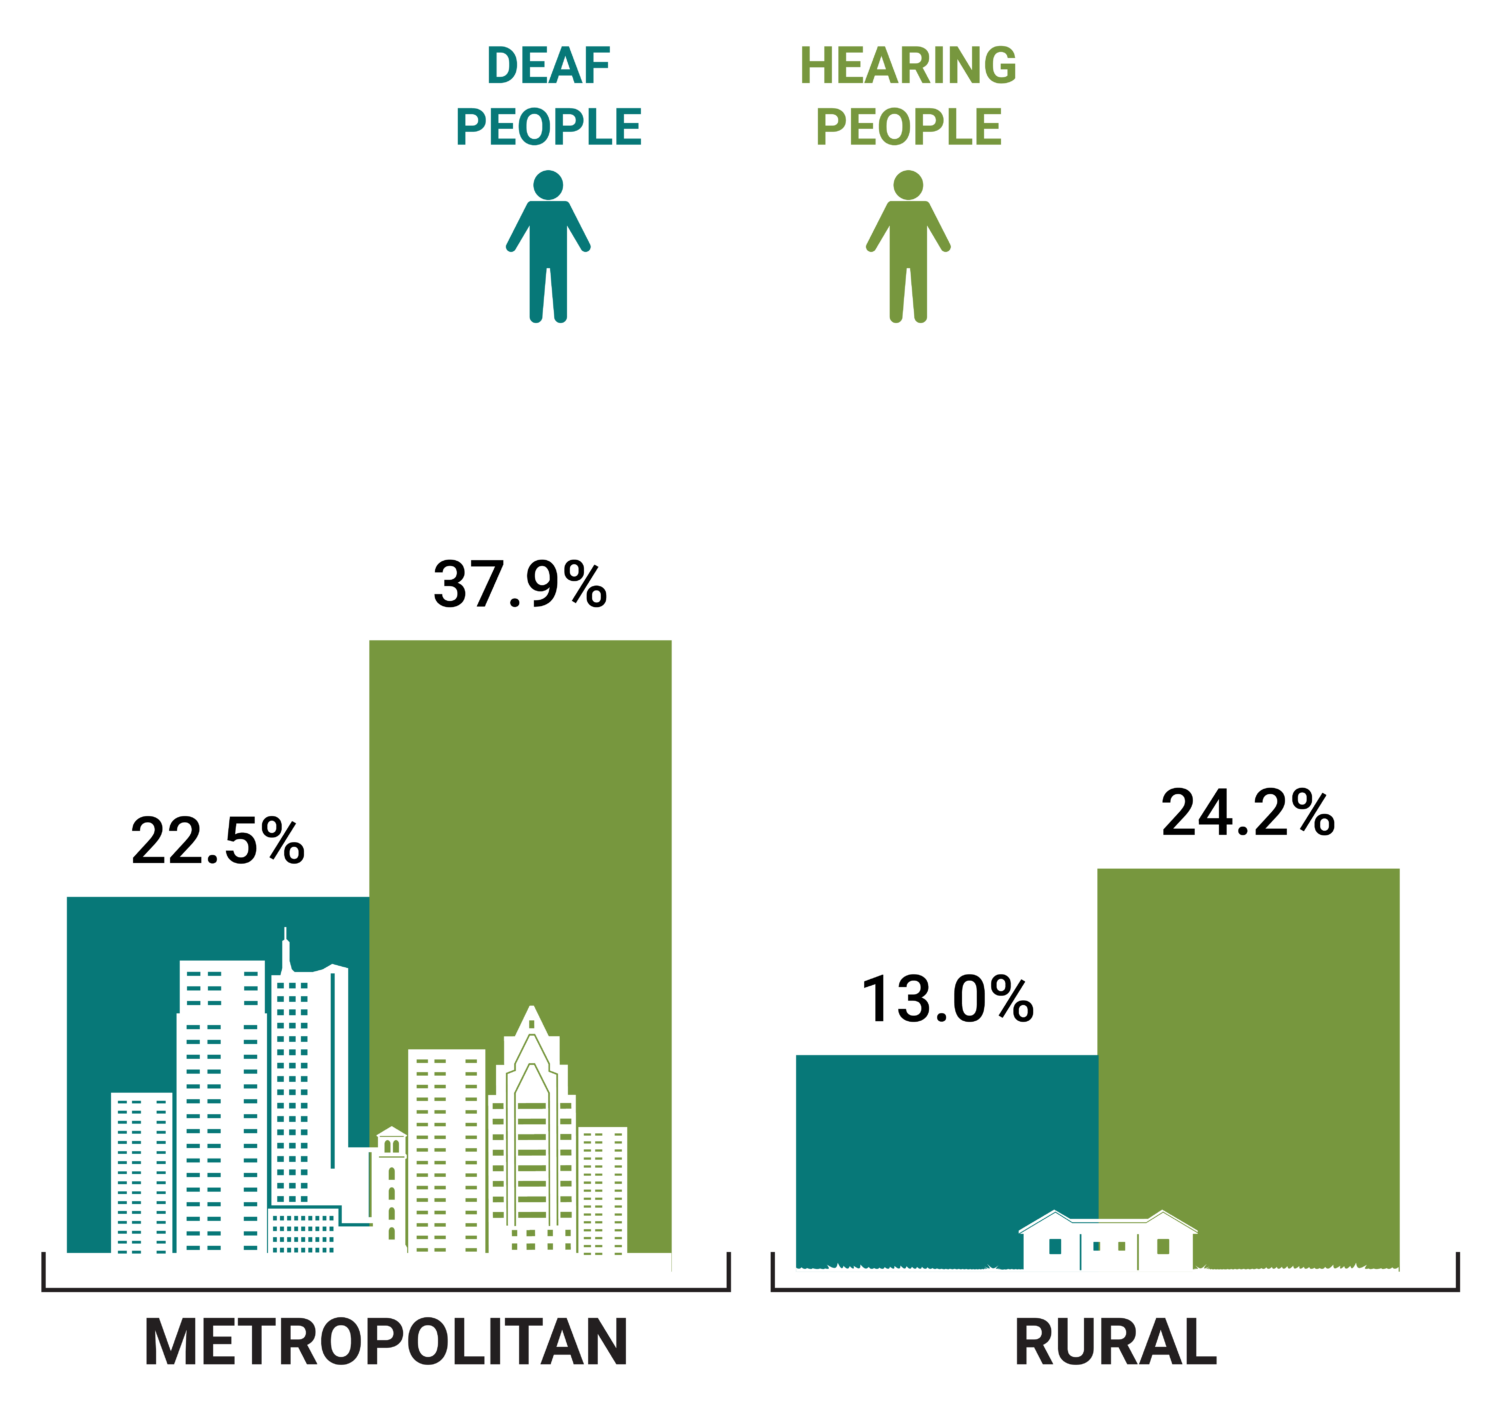
Bachelor’s Degree or Higher
Metropolitan deaf people are almost twice as likely as rural deaf people to have a bachelor’s degree or higher.
Table 1. Employment Rates by Deaf Groups in Rural Areas
Employed
Unemployed
Not in Labor Force
No disability
68.0%
3.4%
28.6%
Deafblind
31.3%
3.5%
65.2%
Deaf with disability
27.4%
3.6%
69.0%
Table 2. Employment By Gender
Deaf Men
Deaf Women
Metropolitan Areas
57.9%
49.1%
Rural Areas
51.8%
43.9%
Table 3. Employment by Race & Ethnicity
Rural Areas
Metropolitan Areas
Asian deaf
50.2%
55.4%
Black deaf
33.9%
42.0%
Latine deaf
46.8%
53.7%
Multiracial deaf
43.3%
50.3%
Native American deaf
36.1%
42.1%
White deaf
51.1%
57.1%
Table 4. Educational Attainment by Area
Education Level
Hearing Status
Metropolitan Areas
High school or higher - DEAF
85.1%
83.6%
High school or higher - HEARING
90.1%
86.4%
AA or higher - DEAF
32.2%
22.6%
AA or higher - HEARING
46.9%
34.9%
Some College or higher - DEAF
55.5%
45.6%
Some College or higher - HEARING
66.3%
56%
BA or higher - DEAF
22.5%
13%
BA or higher - HEARING
37.9%
24.2%
MA or higher - DEAF
8.15%
4.4%
MA or higher - HEARING
14.3%
8.4%
Figure 1: Educational Attainment by Employment in Rural and Metro Areas
The data in this report comes from the 2018-2022 American Community Survey (ACS), which is a yearly survey conducted by the U.S. Census Bureau. It gives us the most up-to-date information about education trends for deaf people in the United States. We used survey participants who identified as deaf or having serious difficulty hearing to represent the deaf population in our analyses. These estimates are based on a sample of 12,181 deaf people between the ages of 16 and 24 from 2018 to 2022. For additional details, please refer to our FAQs page that provides more information about the ACS data.