As we begin the new year, let’s harness the power of data to make informed decisions and navigate our ever-changing world. Use the latest employment and education data from NDC to improve postsecondary outcomes for deaf people.
The U.S. Census Bureau has released 2022 data from the American Community Survey, and we have updated our data dashboard with the latest information. You can use the dashboard to compare your state to the national average, advocate for additional funding and services, and download charts to use in presentations.
Here’s a breakdown of the latest numbers…
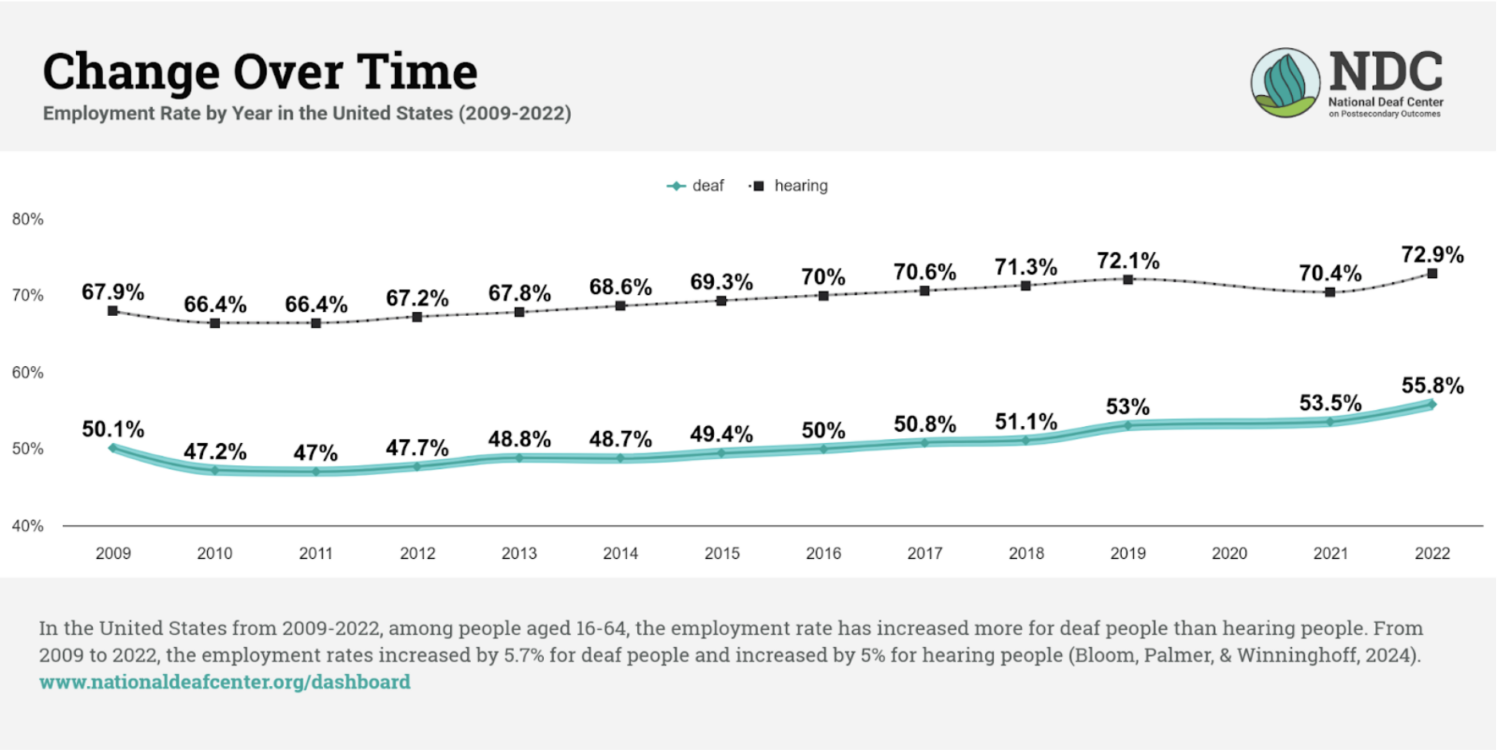
The employment rate for deaf people increased from 53.5% in 2021 to 55.8% in 2022.
The employment rate has been steadily increasing over time and has increased by 8.1% since 2012. While fewer deaf people are employed, compared to hearing people, the employment gap between deaf and hearing people has narrowed slightly over time. This mirrors the nationwide trend of record-high labor force participation among people with disabilities.
Deafdisabled and deafblind people had a big jump in employment rates from 2021 to 2022.
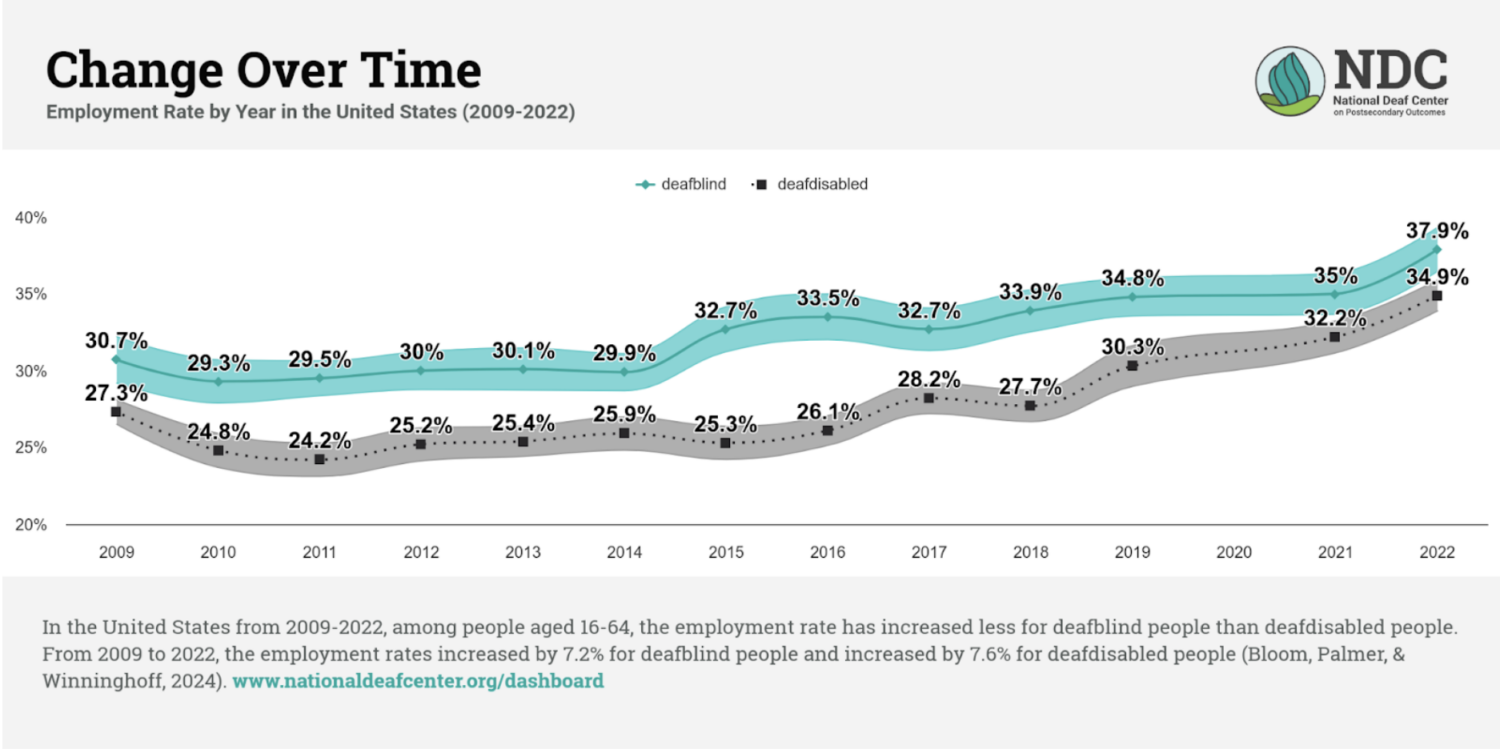
Employment rates for deafblind and deafdisabled people increased by around 2.5% from 2021 to 2022. However, employment rates for deafblind and deafdisabled people still lag behind their peers with no additional disabilities. In 2022, 37.9% of deafblind people and 34.9% of deafdisabled people were employed compared to 72.7% of deaf people with no additional disabilities. Since deaf people with additional disabilities experience more institutional barriers to employment, more attention is needed to provide accessible postsecondary opportunities and to increase access to competitive integrated employment.
Employment rates for Black deaf people are lower than other groups, but steadily increasing over time.
In 2022, 42.3% of deaf Black people were employed compared to 59.8% of Asian deaf, 58.0% of white deaf, and 56.8% of Latine deaf people. However, the employment gap between white and Black deaf people is shrinking as the employment rate has increased more rapidly over time for Black deaf people.
| 2012 | 2022 | ||
|---|---|---|---|
|
Black deaf |
32.4% |
42.3% |
+ 9.9% |
|
white deaf |
50.9% |
58.0% |
+ 7.1% |
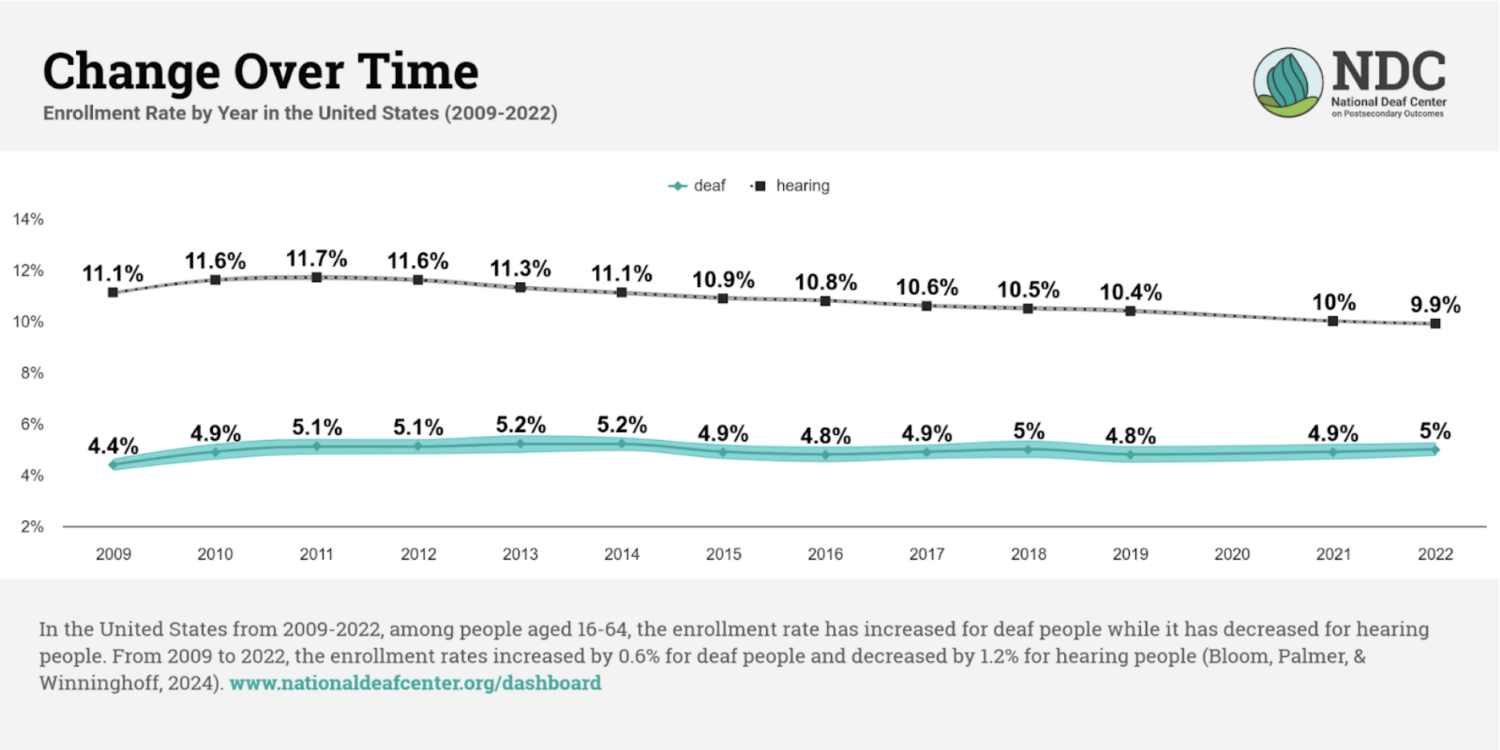
While fewer deaf people enroll in postsecondary education and training than hearing people, enrollment rates have increased slightly since 2021.
Even though there are more postsecondary opportunities than ever before, deaf people are still less likely to enroll than hearing people. In 2022, 5.0% of deaf people were enrolled in postsecondary education and training compared to 9.9% of hearing people. Enrollment rates have steadily decreased across the country – but for deaf people, enrollment rates have either held steady or slightly increased over time.
More deaf people have a bachelor’s degree in 2022 … but so do hearing people.
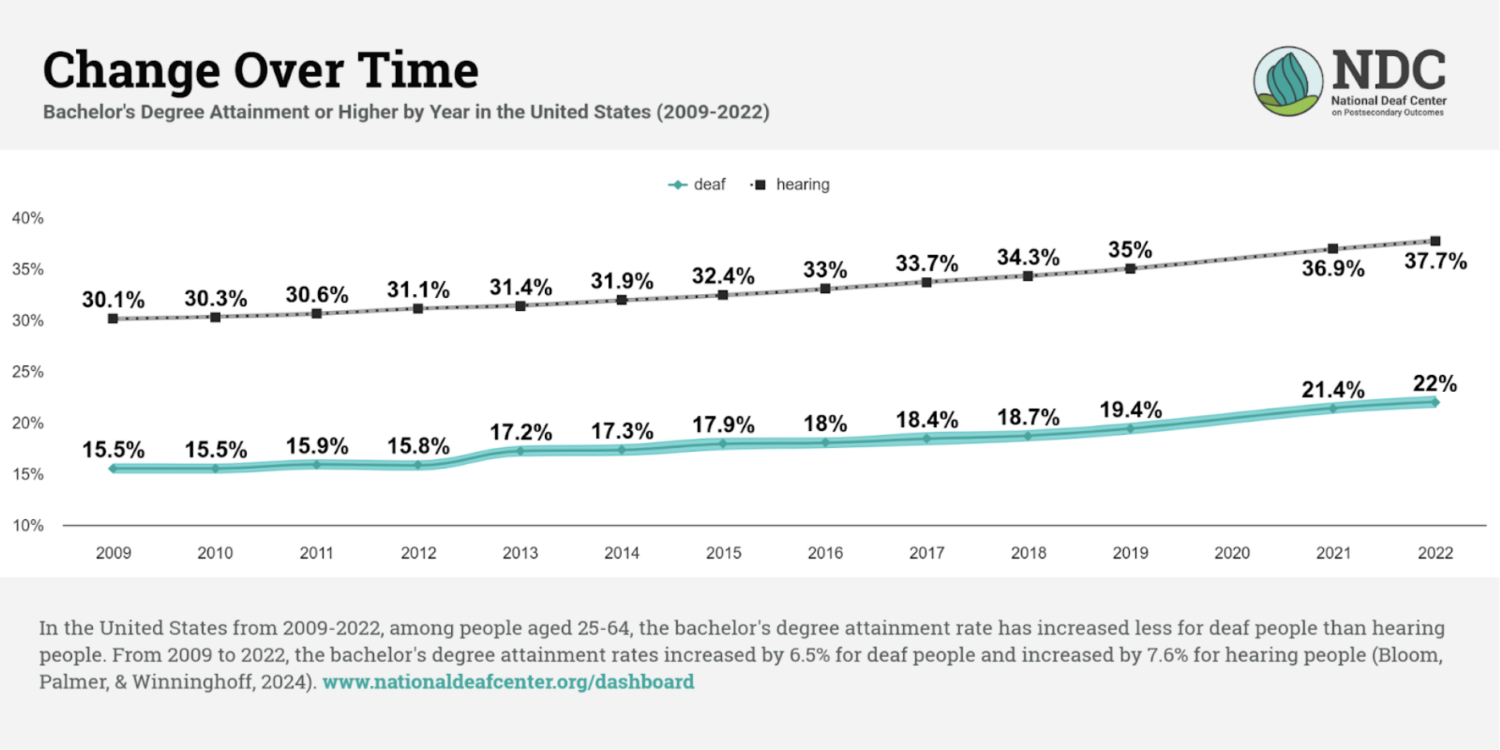
The bachelor’s degree attainment rate has steadily increased over time for deaf people – from 15.5% in 2009 to 22% in 2022. However, this parallels national trends for hearing people across the country. The attainment gap between deaf and hearing people has not narrowed over time.
As always you can use the dashboard to look at...
Your state’s employment rate
Disparities in educational attainment by race & ethnicity
Earnings by additional disability
And much more!
We have also added some new features so you can…
Compare median and mean earnings
Determine the postsecondary enrollment rate
Look at changes over time
For more information about data and data driven-decision making; check out our Research and Data page and explore our data online course.
Recommended Citation
National Deaf Center on Postsecondary Outcomes. (2023, January 16). A new look at 2022 Census data about deaf people. University of Texas at Austin, National Deaf Center on Postsecondary Outcomes.
https://nationaldeafcenter.org/2022CensusData.