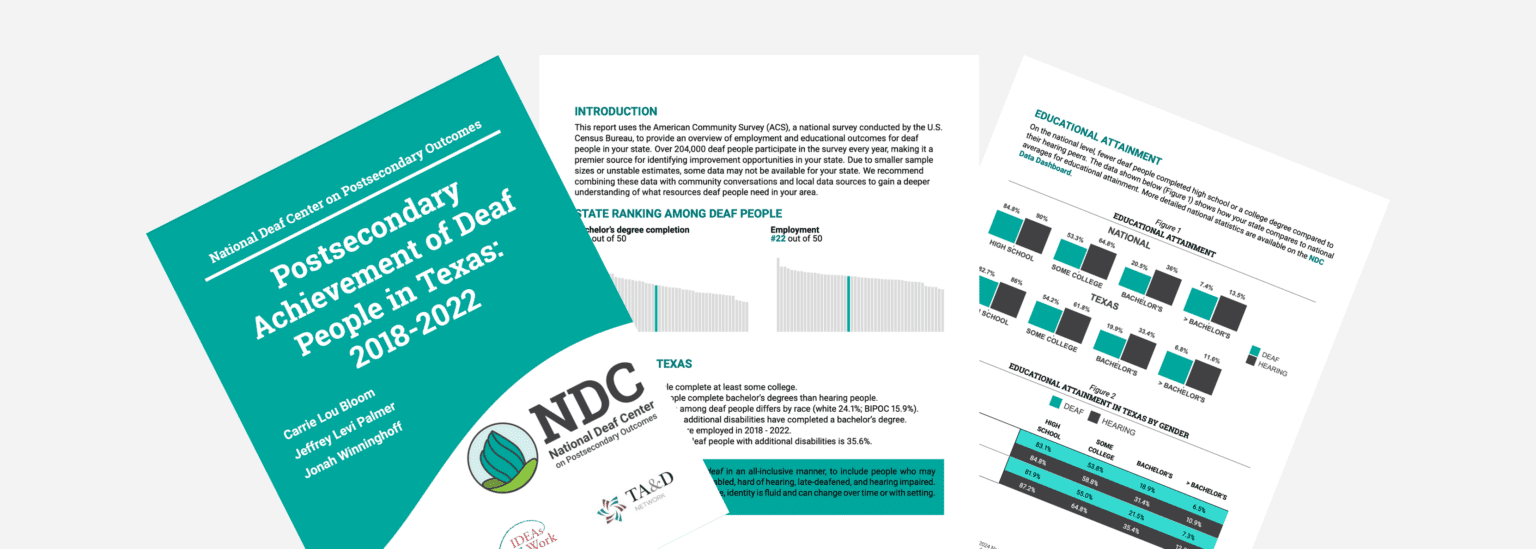

NDC is thrilled to reveal that we’ve updated our State Reports! With the click of a link, you can view and download updated data and gain new insights into the lives and experiences of deaf people in any state across the country.
If you’ve ever wondered about the employment and education statistics for deaf people in your area or how your state compares to others, these reports provide a glimpse into the current landscape. From educational attainment to employment rates, this data offers a comprehensive view of the barriers and successes experienced in each corner of the United States.
Navigating Data
Whether you’re an administrator, educator, disability services professional, or simply a curious advocate, this data empowers you to navigate the complexities of deaf-related statistics effortlessly. Knowledge is power and, armed with insights from our State Reports, you can drive positive change for deaf students in your state. You can use this data to demonstrate inequities, highlight employment and educational achievement gaps, identify subpopulations that experience more barriers, and showcase data by race, gender, or disability.
State education and vocational rehabilitation teams, community agencies and organizations, career centers, and colleges/universities who are working with deaf people on education and employment outcomes often rely on NDC data reports. Some states have used our data for citing employment numbers, applying for grants, as well as other purposes. For example, the Nebraska state team used data from the data dashboard to apply for a grant to fund a summer program, the Idaho team used our national level data report in a grant application for their food truck program, and community members in DC used our data to advocate for a Deaf and Hard of Hearing Commission.
If you’d like to contact us for personalized support, especially in regards to data usage, please email our Help Team at help@nationaldeafcenter.org.


Empowering Change, One State at a Time
Employment rates for deaf people overall have not improved since 2008, and we want to change that. NDC is inviting teams to our new Career Readiness Program to strengthen and increase competitive integrated employment opportunities for deaf people in your community. Collaborative partnerships are an evidence-based practice in transition—and result in better outcomes for people with disabilities. Whether your team wants to tackle an existing program, start fresh, or simply needs a hand in pinpointing areas of improvement, we’re here to support the process.
Ready to embark on a journey of discovery? Dive into our updated State Reports today and turn data into action! We invite you to join us in harnessing the power of information to drive positive change. Together, we can rewrite the narrative and create a future where everyone has the opportunity to thrive in a field they are passionate about.