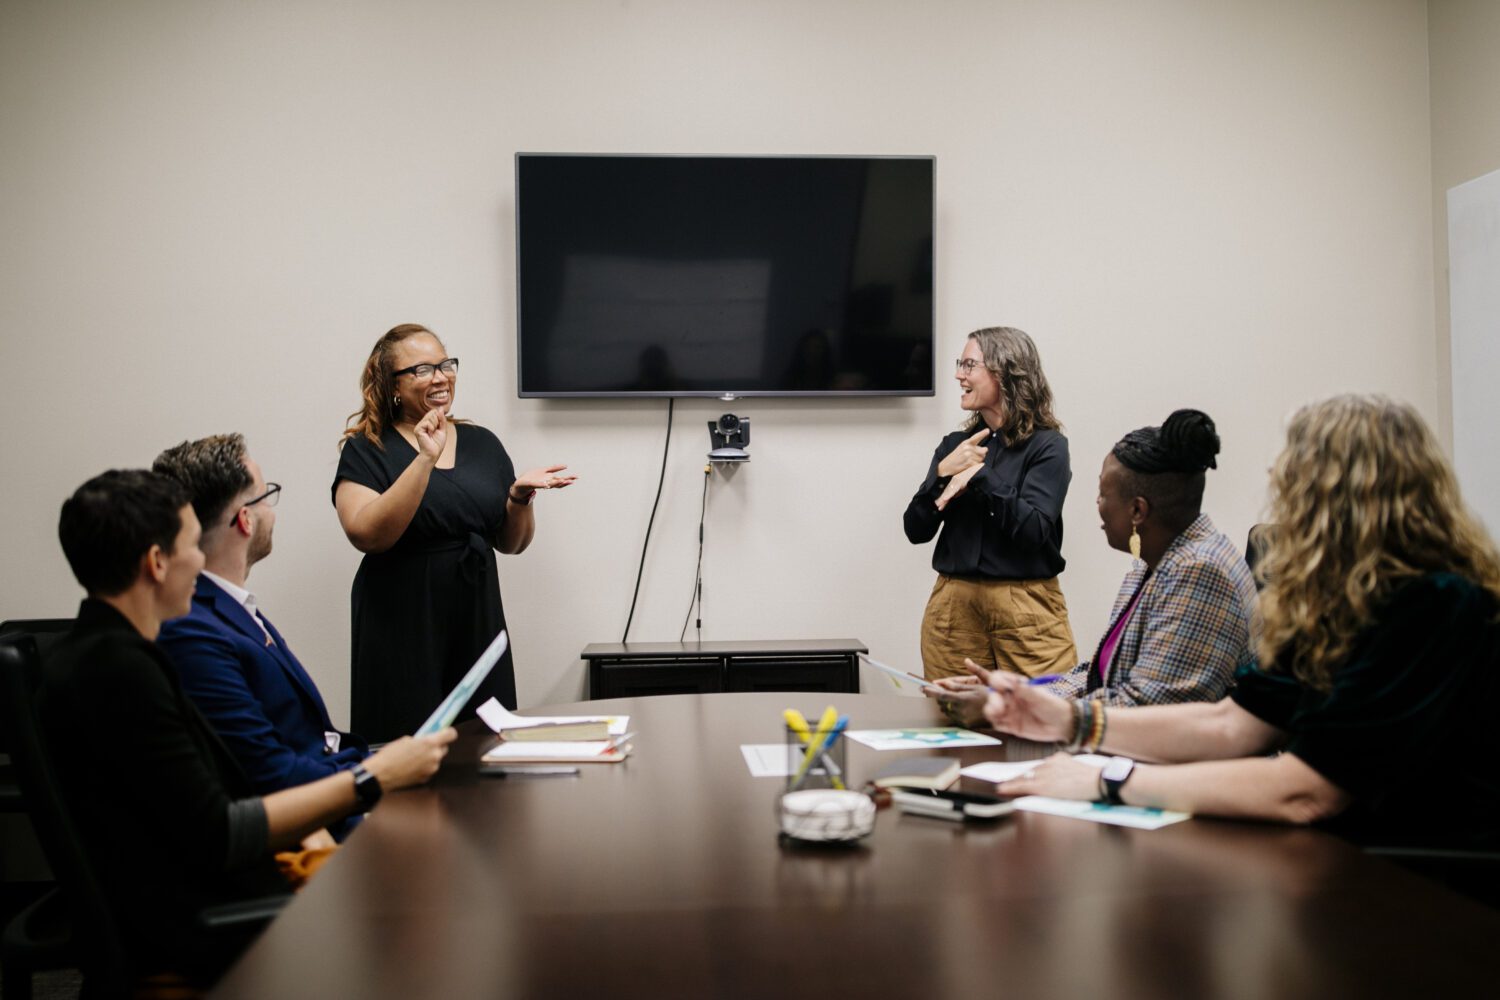
The National Deaf Center on Postsecondary Outcomes has built a web-based interactive data dashboard that showcases a wealth of information and educational statistics about deaf people in the United States. Take a look at our new dashboard and join us in our pursuit to make things better for all deaf people!
Data You Need, When You Need It
The statistics provided through our visual dashboard are derived from the American Community Survey (ACS), conducted by the United States Census Bureau, and are pulled immediately upon annual release. The ACS is a national survey that collects responses to questions from a random sample of about 3.5 million addresses each year. Every year nearly 40,000 deaf people take the American Community Survey, and now this information is available to you!
In order to find the figures you are interested in, select the data points you need and generate specific charts. Whether you are looking for college degree attainment on the national level, or employment rates in your state, our data dashboard can help you find what you’re looking for. This dashboard is an update to our data reports, such as Deaf People and Educational Attainment in the United States and Deaf People and Employment in the United States.
Data Points
Our data dashboard supplies a wide range of statistics—check out just a few of these key figures below:
- What percentage of deaf people are deafblind? 19.5%.
- How many deaf people have jobs? 54.6%. This is 18% lower than the average employment rate for hearing people.
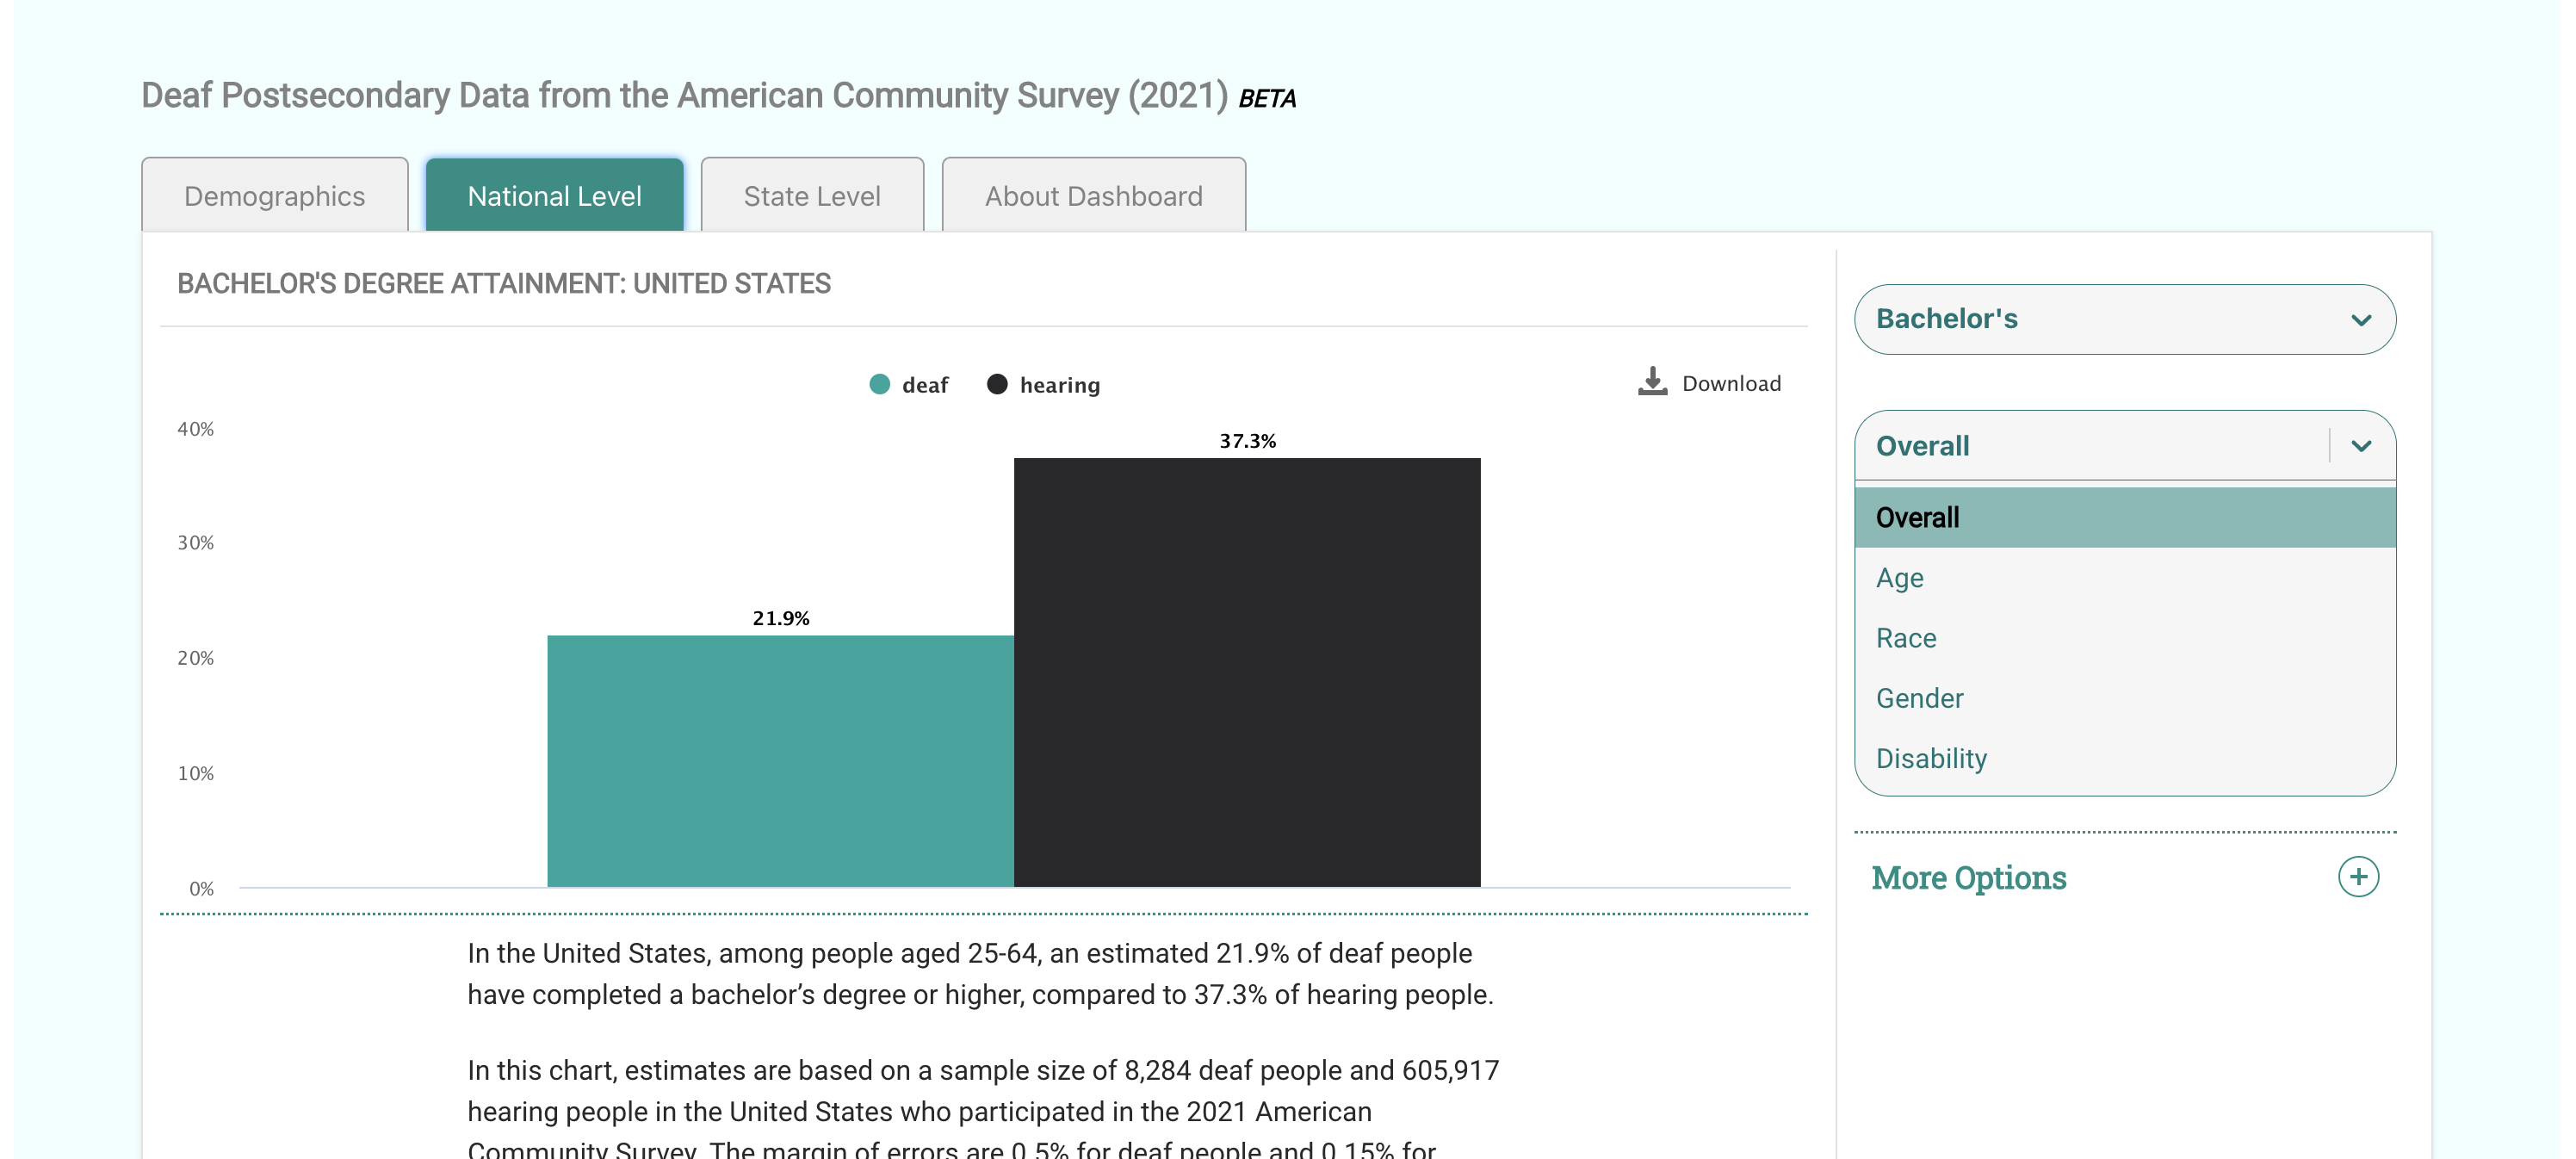
- What percentage of deaf people have a BA degree? 19.8%, compared to 35.4% of hearing people.
- Do more deaf men or women have a master’s degree? Deaf women. 8.2% of deaf women have a master’s degree or higher, compared to 6.7% of deaf men.
- Black deaf (41.7%) and Native American deaf (36.1%) have lower rates of employment compared to white deaf (56.0%).
- Only 13.9% of deafdisabled people have a bachelor’s degree or higher compared to 27.3% of deaf with no additional disabilities
- A larger percentage of deaf men (56.8%) are employed compared to deaf women (48.3%)
Take Action
- Explore the data dashboard and see how your state compares to the national average.
- Breakdown employment and education data by race and ethnicity, disability, and gender to identify inequities.
- Respond to inequities by allocating resources and partnering with local organizations.
NOTE: NDC uses the word deaf as an umbrella term to describe individuals who may identify as Deaf, hard of hearing, hearing impaired, late deafened, and deafdisabled. However, when data addresses specific subgroups, such as those who are deafblind or deafdisabled, NDC will use the relevant term. Additionally, the ACS does not collect data on identity labels or sign language use, and instead asks: “Is this person deaf or does he/she have serious difficulty hearing?” We consider everyone who answers ‘yes’ to this question as deaf, and everyone who answers ‘no’ as hearing.
If you have any questions, or want to share your thoughts with us, please reach out to our Help Team by emailing us at help@nationaldeafcenter.org. We appreciate your thoughts on how we can better improve our data dashboard!