New Updates, Same Great Data
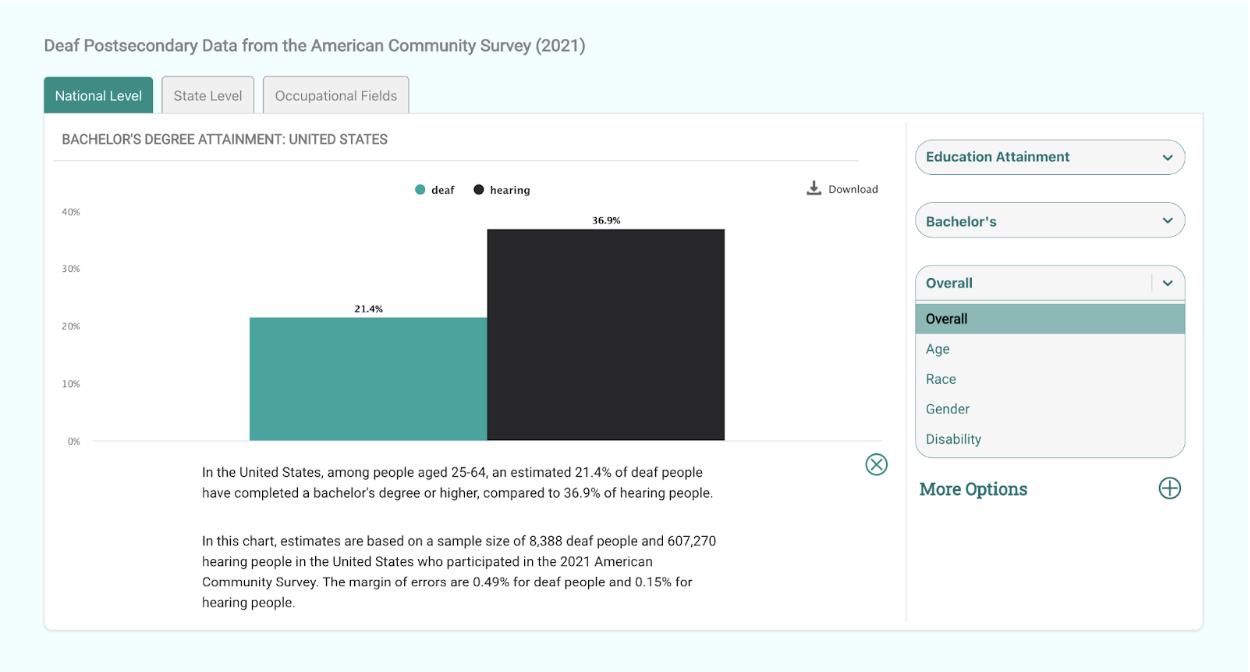
On January 20th, 2023, NDC launched our new data dashboard, a web-based interactive dashboard that showcases a wealth of research data and educational statistics about deaf people in the United States. Since its launch, our data dashboard has undergone some updates and now also includes data from 2020 and 2021!
In addition to viewing educational attainment and employment data at the state- and national-level, you can now answer questions like these:
- Are more deaf people self-employed than hearing people?
- What is the median income for deaf people working full-time compared to hearing people?
- What percentage of deaf people are currently enrolled in postsecondary education?
- What are the most popular majors for deaf people?
- How have employment rates changed over time?
- How do employment rates differ based on degree?
An integral component of the dashboard is the ability to look at key demographic characteristics such as race and ethnicity, gender, and disability to help identify communities that may not be getting enough services in your area.
The newest version of our data dashboard helps you get the most current, accurate data that you need, when you need it, to counter assumptions and myths about deaf people. This data can be used to write grants, proposals, and in any other capacity to support and justify the need for services in your area. We encourage you to export charts from the data dashboard to use in your work to identify opportunities for improvement in your state, and to educate administrators on the need for more programming and support for deaf youth and deaf adults.
Additionally, students are encouraged to check out the dashboard to find information to learn more about salary averages for various fields, discover options for college majors, and even help them choose their careers!
Learn How to Use the Data Dashboard
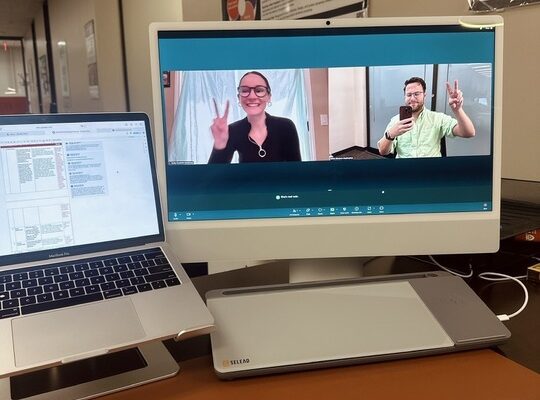
On December 15th, 2022, NDC hosted New Resource Launch: Interactive Data Dashboard!, a webinar aimed at introducing the new data dashboard and about how to use it to identify inequities in your state. If you missed the webinar, don’t worry! The recorded webinar can be found below and is available for you to watch right now.
Presented by Jeffrey Levi Palmer, PhD, this webinar introduced participants to features that are included in our Data Dashboard, how to use it to understand the statistics being shared, as well as some insights into the data itself. Within the dashboard, you can find the following data points:
- Educational attainment
- Employment status
- Most popular majors
- Median earning
- Type of employment
- Change over time
- Education compared with employment & earnings
- Breakdowns for each of the above items based on state and national averages as well as race, ethnicity, disability, and gender
Please note that our team is constantly working to bring you the latest upgrades. The dashboard will be updated periodically as new information becomes available.
For additional support, contact our help team at help@nationaldeafcenter.org.
Watch the Full Webinar to Learn How to Use the Dashboard!
Full video description: https://tinyurl.com/yjdrss65